
Pluvial Flood Simulation in Urban Spaces
This page is designed to accompany a presentation on the methodological steps of urban, pluvial flood simulations. It is designed with interactive components so that visitors can explore and learn about this process and my experience with MIKE+ software!
.png)
Final Seminar Paper:
Pluvial Flooding
A pluvial flood occurs when an extreme rainfall event creates a flood independent of an overflowing water body.
-
Increasing probability
-
Can be difficult to foresee
We can differentiate between:
Surface Water Floods
Flash Floods
-
sewer system at capacity
-
gradual onset
-
not life threatening
-
can cause considerable economic damages
-
extreme rainfall or sudden water release
-
rapid onset
-
can be dangerous for people
-
can cause considerable economic damages
Austria's Risk Areas by Flood Cause
.png)
Fluvial Flooding
Fluvial and Pluvial Flooding
Pluvial Flooding
Why Simulate Pluvial Flooding?
Use for urban planning (pre-construction), improvements (post-construction), and risk assessment!
Carr and Smith (2006) mention a few concrete questions that are often answered in studies on urban flooding:
• Where in the catchment does significant flooding start to occur?
• What is the capacity of the stormwater asset? (Is there sufficient inlet capacity? Are the pipes large enough?)
• Are all the potential overland flow paths serviced by the stormwater asset?
• Where are the significant overland flow paths?
• Do the overland flow paths change in larger storm events?
.png)
Theory, Literature, Models
Linking 1D and 2D models
.png)
The 1D model represents the minor system (channels or rivers)
The 2D model represents the major system (overland areas)
Modelling Floods in 1D:
-
Computationally fast
-
Good for channel and river representation
-
Complex systems can be difficult to set up
-
Can be poor at flood routing
.png)
.png)
Modelling Floods in 2D:
-
"Easy" once the grid is generated
-
Computationally demanding
-
Very accurate for surface runoff and flood routing
1D-2D Coupling: the "best of both worlds"
But there's more to flood simulations than just the computational 1D, 2D models. To make it work, any GIS will need much more information input.
1D Collection System
2D Domain (grid)
Catchments
Hydrological Models
Time Series
Boundary Conditions
.png)
Some Applied Methods in the Literature

Urban Inundation Model
UIM
The Urban Inundation Model
Chen & Djordjevic (2012)

A 2D non-inertial overland flow model that can be driven by a spatially and temporally varying rainfall input

SFMM
GIS framework for Spatiotemporal Flood Modeling and Mapping

The Urban Inundation Model
GIS Framework for Spatiotemporal Mapping of Urban Flooding
Abedin and Stephen, 2019
A GIS-framework including the delineation of an urban watershed, the generation of runoff hydrographs, and time series mapping of inundation depths and flood extent.

The Urban Rainstorm Inundation Simulation
Meng et al. (2019)

Integrates 3 components:
Soil conservation service (SCS) module, a surface flow module, and a drainage flow module
URIS
Urban Rainstorm Inundation Simulation
Methodology
Software: DHI MIKE+
An integrated water modelling platform
License: Student (thesis) license
.png)
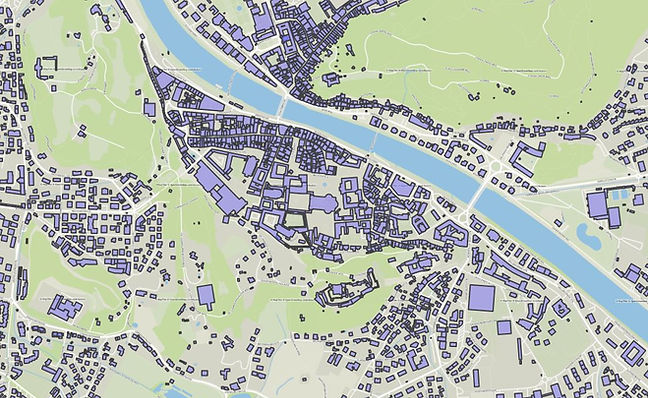
My "Sandbox": Salzburg city center. An area with high levels of impervious ground.

My Sandbox: Salzburg's city center, surrounding the cathedral
> impervious ground
The Workflow
fill

export to *.asc

Crop and convert to *.dfs2
Change to Bathymetry type


Model Setup for new Project
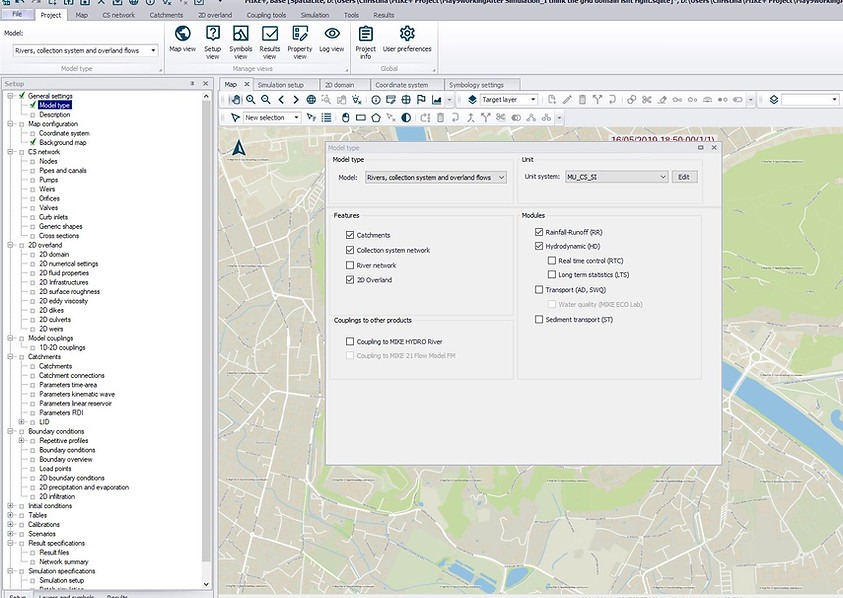
2D Overland Domain


1D Collection System


Catchment Delineation and Connection

Manual delineation or automated with use of a filled DSM in *.asc
Catchment connection to 1D collection system (catchment - nodes)
.png)
Hydrological Model Setup
Hydrological Models for Rainfall Runoff Computation:
Surface Runoff vs Continuous Runoff
Surface Runoff models in MIKE+:
-
Time-Area Method (A)
-
Kinematic Wave (B)
-
Linear Reservoir (C1 and C2)
-
Unit Hydrograph Method (UHM)
Time-Area Method:
The amount of runoff is controlled by the initial loss, the size of the contributing area and by a continuous hydrological loss.
The shape of the runoff hydrograph is controlled by the concentration time and by the time-area (T-A) curve. These two parameters represent a conceptual description of the catchment reaction speed and the catchment shape.


1D-2D Coupling

Boundary Conditions


Simulation Setup
Run!

(Validation & Calibration)
Results and Discussion
Rainfall Runoff in Catchments over Time
Profile Plot
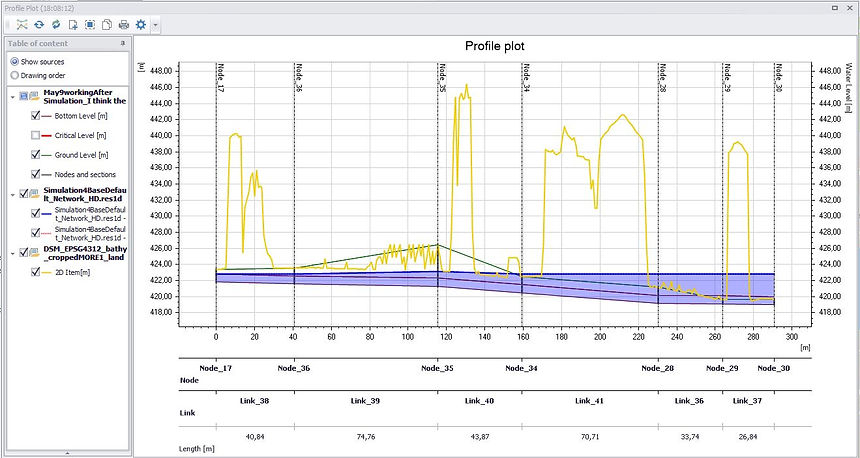

Collection System Load


Catchment Runoff Time Series

Catchment Runoff and Collection System
+ The integration of a multitude of water-related models
+ Realistic calculations can be derived
+ Once one is familiar with the software, it becomes a highly
practical, powerful tool
- Complexity of parameterisation (without training)
- Lack of data format standardisation - multitude of proprietary
data formats, depreciated file and projection conversion tools
- Since it is a highly specialised software, it is not mainstream and
online user forums are limited
With appropriate training and dedication (e.g. as professional career path), MIKE+ presents itself as an ideal GIS perform for pluvial flood simulations.

.png)
Thoughts on Flood Simulations (with MIKE+)